The term “Big Data” refers to the evolution and use of technologies that provide the right user at the right time with the right information from a mass of data that has been growing exponentially for a long time in our society. The challenge is not only to deal with rapidly increasing volumes of data but also the difficulty of managing increasingly heterogeneous formats as well as increasingly complex and interconnected data.
Being a complex polymorphic object, its definition varies according to the communities that are interested in it as a user or provider of services. Invented by the giants of the web, the Big Data presents itself as a solution designed to provide everyone a real-time access to giant databases. It is not defined by a set of technologies, on the contrary, it defines a category of techniques and technologies. This is an emerging field, and as we seek to learn how to implement this new paradigm and harness the value, the definition is changing.

Characteristics of Big Data
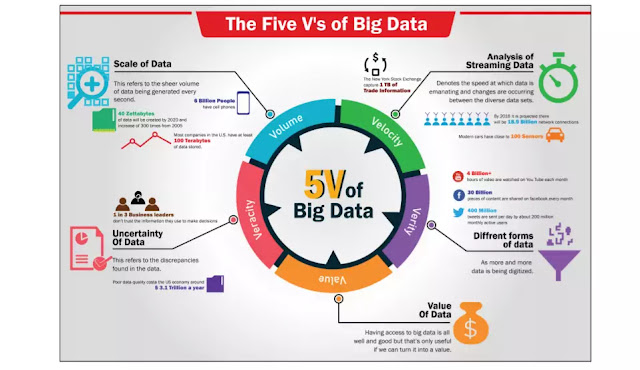
The term Big Data refers to gigantic larger datasets (volume); more diversified, including structured, semi-structured, and unstructured (variety) data, and arriving faster (velocity) than before. These are the 5V.
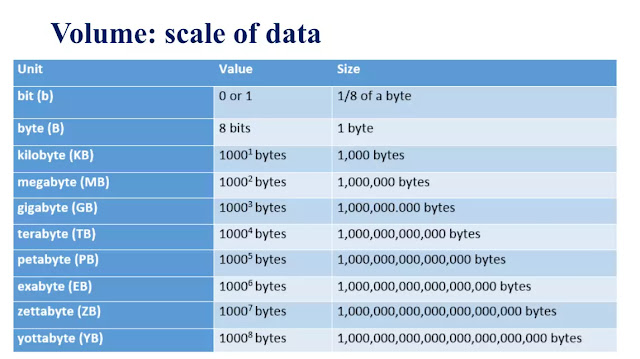
-Volume: represents the amount of data generated, stored and operated within the system. The increase in volume is explained by the increase in the amount of data generated and stored, but also by the need to exploit it.
-Variety: represents the multiplication of the types of data managed by an information system. This multiplication leads to a complexity of links and link types between these data. The variety also relates to the possible uses associated with a raw data.
-Velocity: represents the frequency at which data is generated, captured, and shared. The data arrive by stream and must be analyzed in real-time.
-Veracity: level of quality, accuracy, and uncertainty of data and data sources.
-Value: the value and potential derived from data.
WHAT IS BIG DATA ANALYTICS ?
The analysis of structured data evolves due to the variety and velocity of the data manipulated. Therefore, it is no longer enough to analyze data and produce reports, the wide variety of data means that the systems in place must be capable of assisting in the analysis of data. The analysis consists of
automatically determining, within a variety of rapidly changing data, the correlations between the data in order to help in the exploitation of it.
Types of Big Data Analytics
a) Descriptive Analytics
It is a preliminary stage of data processing that creates a set of historical data. Data mining methods organize data and help uncover patterns that offer insight. Descriptive analytics provides future probabilities and trends and gives an idea about what might happen in the future.
b) Diagnostic Analytics
It consists of asking the question: Why did it happen? Diagnostic analytics looks for the root cause of a problem. It is used to determine why something happened. This type attempts to find and understand the causes of events and behaviors.
c) Predictive Analytics
It consists of asking the question: What is likely to happen? It uses past data in order to predict the future. It is all about forecasting.
d) Prescriptive Analytics
It consists of asking the question: What should be done? It is dedicated to finding the right action to be taken. Descriptive analytics provides a historical data, and predictive analytics helps forecast what might happen. Prescriptive analytics uses these parameters to find the best solution.
The Information Continuum
- Data
- Information
- knowledge
- Insight
- Wisdom
Types of Data
Quantitative Data
Qualitative Data
Categories of Big Data
Black Box Data: It includes the conversation between crew members and any other communications (alert messages or any order passed) by the technical ground duty staff.
Social Media Data: Social networking sites such as Facebook and Twitter contains the information and the views posted by millions of people across the globe.
Stock Exchange Data: It holds information (complete details of in and out of business transactions) about the ‘buyer’ and ‘seller’ decisions in terms of share between companies made by the customers.
(Data) Power Grid
(Data) Search Engine
What is the importance of Big Data?
- Finding the root cause of failures, issues and defects in real time operations.
- Recalculating entire risk portfolios in just minutes.
- Detecting fraudulent behavior before it affects and risks your organization.
Big user of this Technology?
- Banking
- Government
- Education
- Health Care
- Manufacturing
- Retail
Big Data and Librarians
• What role will librarians play in the Big Data revolution?
• Do you see yourself playing a part?
• How will you prepare yourself?
• What resources will you use?
Operational Big Data vs.
Operational Big Data1) It includes the applications such as Mango Db which provides operational capabilities for interactive and real time workloads where data is generally captured and stored. 2) No SQL Big Data systems are designed in such a way it capitalizes on new cloud computing architectures, to permit access on massive commutations to be run reasonably and efficiently. | Analytical Big Data1)It owns the systems like Massively Parallel Processing database systems and Map Reduce which provides the analytical capabilities for re collective and complex analysis. 2) SQL Map Reduce that can be scaled up form single server to thousand of high and low end machines. |
Barriers
Barriers that are imposed on Big Data are as follows:
- Capture Data
- Storage Capacity
- Searching
- Sharing
- Transfer
- Analysis
- Presentation
Is data visualization a part of data science?
Data Science and Data Visualization are not tow different enteritis. They are bound to each other. Data Visualization is a subset of data science. Data science is not a single process or a method or any workflow.
Data Visualization Software
- WhSisense
- Looker
- Periscope Data
- Zoho Analytics
- Tableau
- Domo
- Microsoft Power BI
- Qlikview
Data discovery answers the questions,”what does it all mean?”
Data visualization is its representation.
References
The Big Data Revolution, Issues and Applications, Azzeddine Riahi, Sara Riahi- IJARCSSE, Volume 5, Issue 8
Riahi, Youssra and Riahi,Sara.(2018).Big Data and Big Data Analytics: Concepts, Types and Technologies.International Journal of Research and Engineering,Vol. 5 No. 9 ,PP. 524-528 Retrieved from https://www.researchgate.net/publication/ 328783489 _Big_Data_ and _Big_ Data_Analytics_ Concepts_Types_and_Technologies
Ganguly, Shantanu.(2019) Big Data and Data Visualization. Retrieved From https://ETTLIS%/Week%209%20-Module-1%20PPT-%20Big%20Data%20and%20Data%20Visualization.pdf


